Meeting reports provide user attendance and absence statistics for meetings, preparation and contribution information and meeting cost information.
![]() For general information on generating
reports, see "Working with
dashboards".
For general information on generating
reports, see "Working with
dashboards".
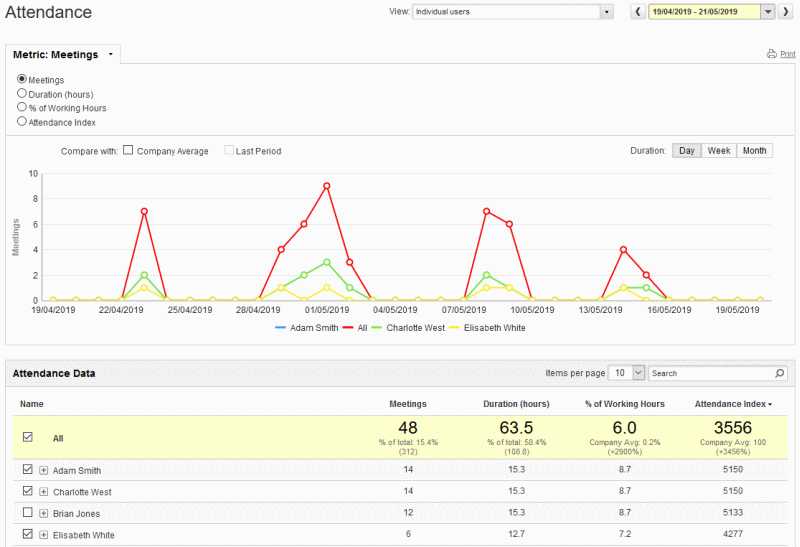
The Attendance report provides information on meeting attendance for the selected users, giving you a quick overview of how much time they have spent in MeetingBooster meetings in the date range selected.

The percentage of working hours is calculated relative to a 40-hour working week (from 8:00 AM to 4:00 PM Monday through Friday).
 Select
Company Average or Last
Period to display these values in the chart for easy comparison.
 Use
the Duration buttons to break
down the displayed values by day, week or month.
 Select
individual users in the table to display them in the chart.
 Click
the plus sign
 ![]() next to a user
name to expand a list of that user's meetings. Click the minus sign
next to a user
name to expand a list of that user's meetings. Click the minus sign ![]() to hide the list again.
to hide the list again.

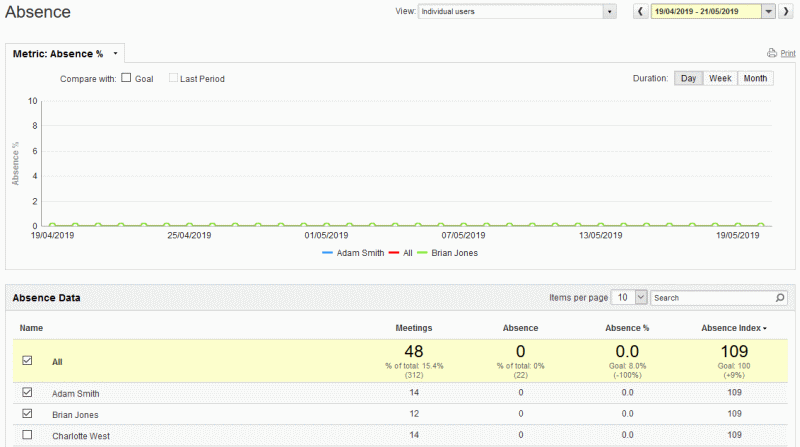
The Absence report provides information on absence from meetings where the selected users were required or were scheduled to attend as organizers of the meeting, and did not decline the meeting in MeetingBooster. The report therefore does not include meetings where the user declined the meeting invitation in MeetingBooster, or where the user was not the organizer or required.

 Select
Goal or Last
Period to display these values in the chart for easy comparison.
 Use
the Duration buttons to break
down the displayed values by day, week or month.
 Select
individual users in the table to display them in the chart.
 Click
the plus sign
 ![]() next to a user
name to expand a list of meetings that user has been absent from. Click
the minus sign
next to a user
name to expand a list of meetings that user has been absent from. Click
the minus sign ![]() to hide the list
again.
to hide the list
again.
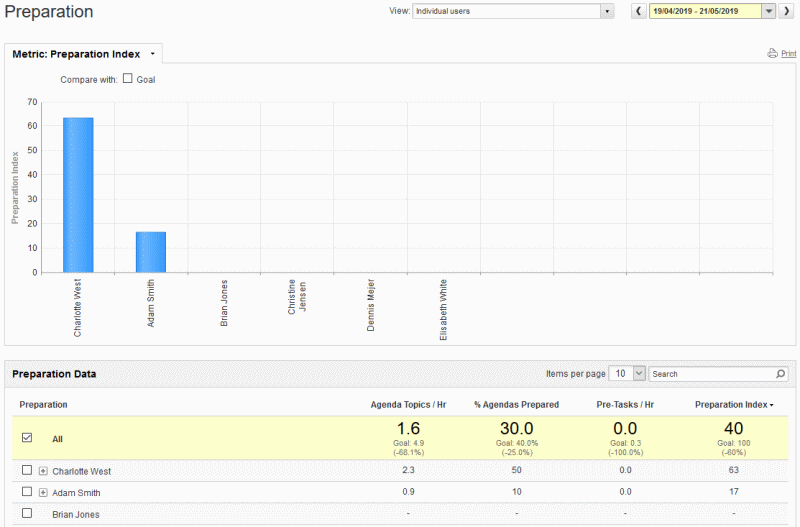
The Preparation report provides information on how well meetings are prepared by the organizers

![]() The Preparation report focuses on the
organizer only. Even though regular attendees can create tasks for a meeting
that they have been invited to join, all tasks created for meetings included
in this report are attributed to the meeting organizers regardless of
who actually created the tasks.
The Preparation report focuses on the
organizer only. Even though regular attendees can create tasks for a meeting
that they have been invited to join, all tasks created for meetings included
in this report are attributed to the meeting organizers regardless of
who actually created the tasks.
 Select Goal
to display this value in the chart for easy comparison.
 Select individual users in the table to display
them in the chart.
 Click the plus sign
 ![]() next to a user name to expand a list of meetings that user has organized.
Click the minus sign
next to a user name to expand a list of meetings that user has organized.
Click the minus sign ![]() to hide the list again.
to hide the list again.
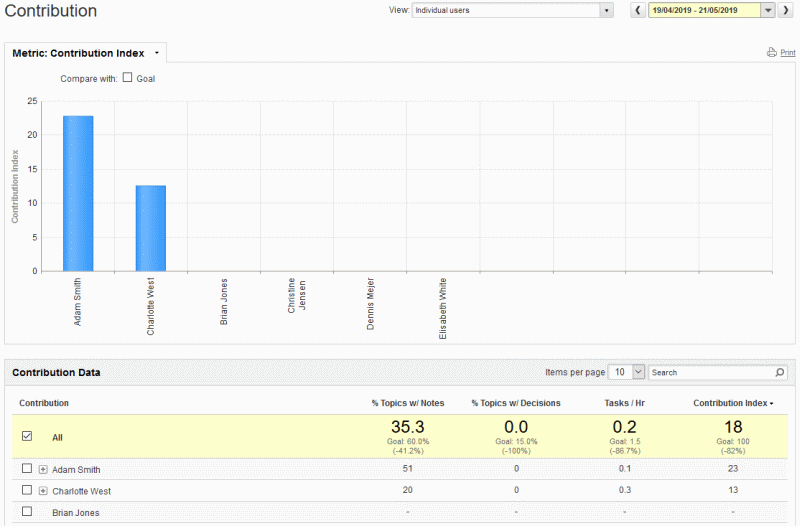
The contribution report provides information on measurable activities during the meetings organized by the selected users by tracking how many notes and tasks are created and saved.

 Select Goal
to display this value in the chart for easy comparison.
 Select individual users in the table to display
them in the chart.
 Click the plus sign
 ![]() next to a user name to expand a list of meetings that the user has
organized. Click the minus sign
next to a user name to expand a list of meetings that the user has
organized. Click the minus sign ![]() to hide
the list again.
to hide
the list again.
The Costs report provides information on the cost of executed meetings based on the salary information of the attendees and the meeting duration.
![]() To view and generate this report, your
security roles must grant you the View Salary permission. For more information,
see "Managing security roles".
To view and generate this report, your
security roles must grant you the View Salary permission. For more information,
see "Managing security roles".
![]() The Costs report does not take into
account meeting costs associated with e.g. materials, locations, catering
and external consultants who have not been created as users in the organization's
MeetingBooster installation. It provides the cost of internal man-hours
used for meetings.
The Costs report does not take into
account meeting costs associated with e.g. materials, locations, catering
and external consultants who have not been created as users in the organization's
MeetingBooster installation. It provides the cost of internal man-hours
used for meetings.

 Select
Company Average to display this
value in the chart for easy comparison.
 Use
the Duration buttons to break
down the displayed values by day, week or month.
 Click
the plus sign
 ![]() next to a month
to expand a list of meetings for that month. Click the minus sign
next to a month
to expand a list of meetings for that month. Click the minus sign ![]() to hide the list again.
to hide the list again.