The four performance reports provide an executive overview of your organization's MeetingBooster performance. They include indexes from several other reports, summing up different usage statistics for meetings, meeting series, hosts and attendees.
![]() For general information on generating
reports, see "Working with
dashboards".
For general information on generating
reports, see "Working with
dashboards".
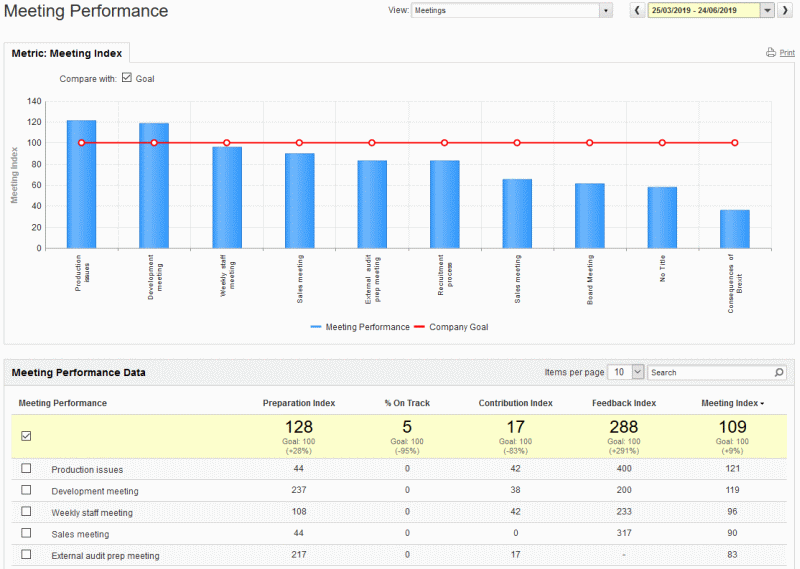
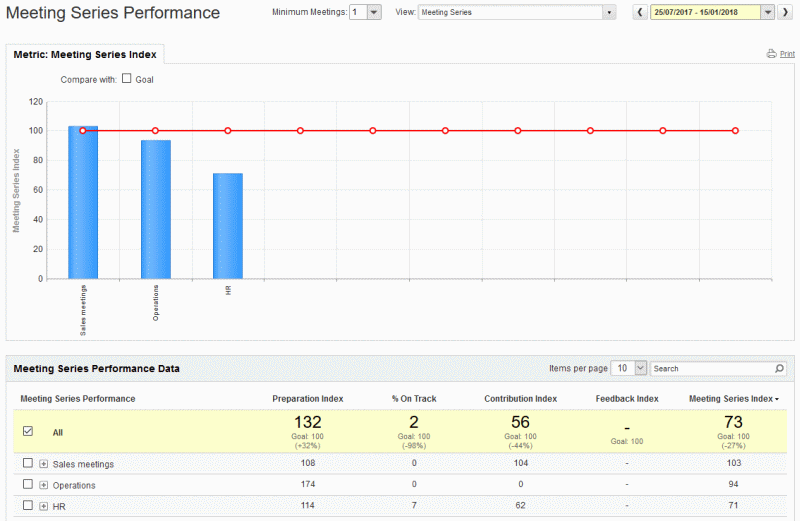
The Meeting Performance and Meeting Series Performance reports differ from all other dashboard reports in that you do not select users for the reports. The reports sum up performance data for meetings and meeting series, and you therefore select which meetings or meeting series, not users, the reports should be based on.
The reports provide data on preparation, timeliness, meeting contribution and feedback that can also be accessed using other reports. These two performance reports, however, provide a way of getting an overview based on meetings instead of users.
The Meeting Index/Meeting Series Index, which measures the overall meeting/meeting series performance relative to the company goal, is displayed in the chart.


 Select
Goal to display this value in
the chart for easy comparison.
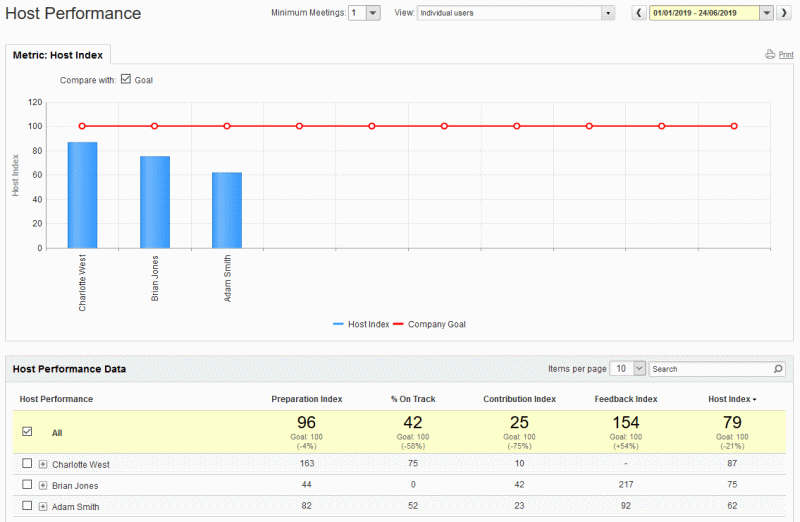
The Host Performance report summarizes how the selected users have performed as hosts of meetings. The hosts are assessed using almost the same metrics as for the Meeting Performance and Meeting Series Performance reports above; however, this report focuses on the meeting hosts instead of the meetings themselves.

The Host Index, which measures the overall performance of the host in the meetings hosted relative to the company goal, is displayed in the chart.
 Select
Goal to display this value in
the chart for easy comparison.
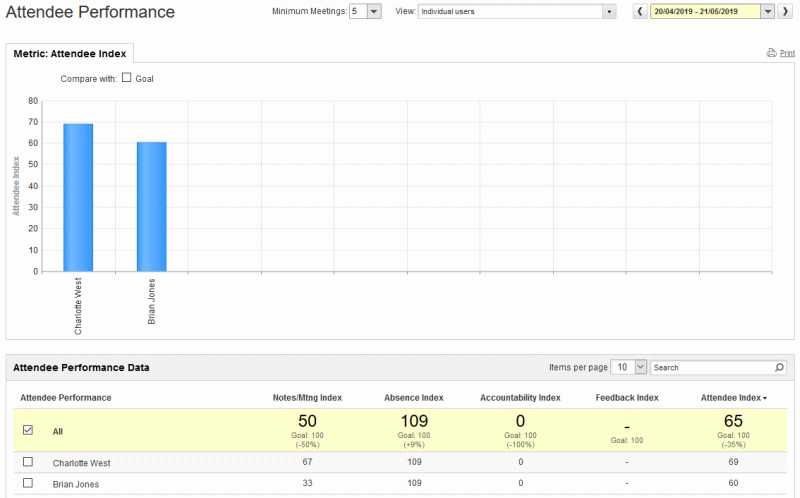
The Attendee Performance report summarizes how the selected users have performed as meeting attendees. The report is very similar to the Host Performance report, but attendees are assessed on different parameters. For example, attendees are evaluated on their ability to finish tasks on time.

The Attendee Index, which measures the overall performance of the attendee in the meetings attended relative to the company goal, is displayed in the chart.
 Select
Goal to display this value in
the chart for easy comparison.